A data-driven guide to designing landing pages that captivate, build trust, and drive action.
The 50 Millisecond First Impression
You have less than a blink of an eye to capture a user's attention. A clean design and a clear value proposition are not just important; they are critical for preventing immediate user abandonment.
The Core Conversion Framework
A successful landing page guides the user through a logical sequence, from capturing their attention to prompting a final action. Each step builds upon the last to create a seamless conversion path.
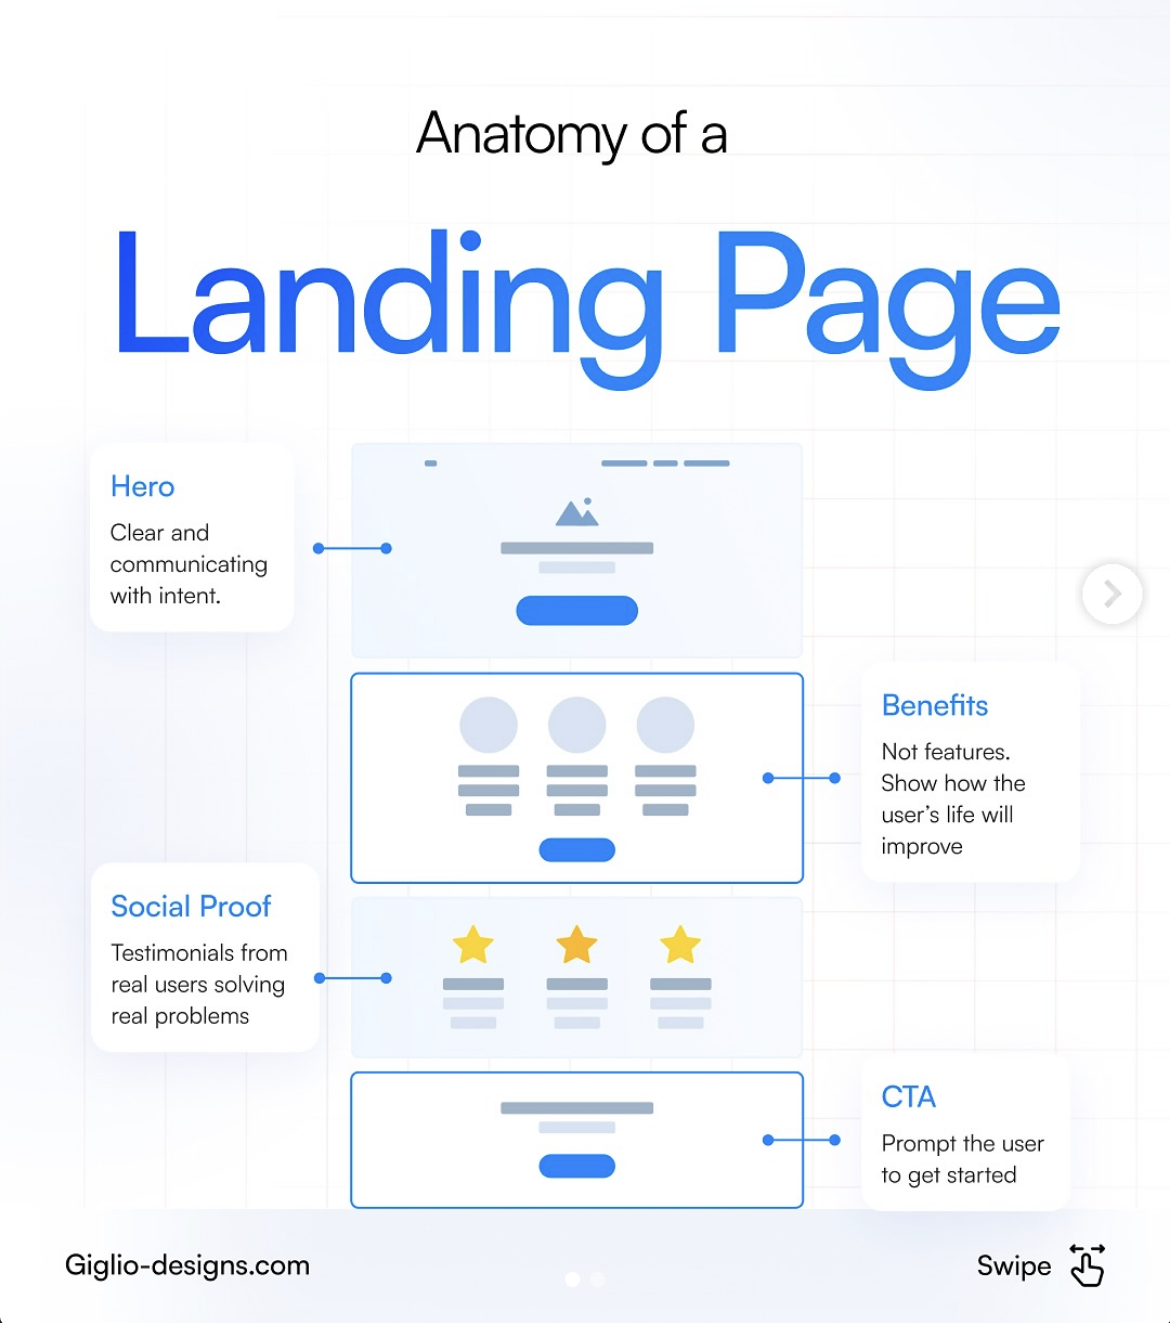
1. The Hero
Grab attention with a compelling headline and visual.
2. The Benefits
Articulate value by focusing on outcomes, not just features.
3. Social Proof
Build trust with testimonials, reviews, and case studies.
4. The CTA
Drive the conversion with a clear, compelling call to action.
Industry Conversion Rate Benchmarks
"Best" is relative. Conversion rates vary significantly across industries, highlighting the need for context-specific design and goals. While the overall average hovers around 2.35%, top performers achieve over double that rate.
The Pillars of Trust
Social proof is a multi-faceted tool for building credibility. While direct user ratings and testimonials are highly impactful, a combination of different trust signals creates the most robust validation for potential customers.
The Engine of Optimization: A/B Testing
A landing page is never truly "finished." The highest conversion rates are achieved through a continuous cycle of testing, analyzing user behavior, and implementing data-driven improvements.
1. Test
Formulate a hypothesis and test variations of key elements like headlines or CTAs.
2. Analyze
Use analytics and heatmaps to measure impact on conversion, bounce rate, and engagement.
3. Implement
Deploy the winning variation and establish it as the new baseline for future tests.

Tom Lawreszuk - Vandesign.ca project manager


